
CLICCS
Cluster of ExcellenceClimate, Climatic Change,
and Society (CLICCS)
and Society (CLICCS)
Photo: UHH/Denstorf
21 September 2026, by Franziska Neigenfind

Photo: Thomas Wasilewski
How reliably can extreme weather events like heatwaves and torrential rains be predicted? In a new CLICCS study, a team led by Dr. Lukas Brunner shows that random variability in the climate system has a substantial influence on how often extreme events occur, and in which intensity. “This aspect is particularly relevant for sensitive regions, as natural climate variability can, in the short term, amplify or weaken these extreme events, significantly affecting forecasts,” Lukas Brunner explains. “To arrive at a more realistic picture, we use this as our point of departure.”
The researchers’ approach involved 50 simulations of a single climate model; they used it in order to investigate the effects of natural climate variability on 26 indicators of climate extremes around the globe – such as the number of extremely hot days or the number of so-called tropical nights (with temperatures over 20 degrees), but also the durations of cold snaps and of torrential rains. Drawing on this extensive simulation ensemble, the team was for the first time able to systematically map and visualize the scope of the uncertainty stemming from internal climate variability on a global scale.
The study shows for example that in regions like the Great Plains, well known as the breadbasket of the USA, extreme heat events are greatly influenced by random variability. Due to this variability, extreme temperatures of over 40 degrees Celsius, as we have now come to expect in the current climate, can rise by an additional 2 degrees or more. The situation is similar when it comes to extreme precipitation events in Europe: due to the influence of natural variability, the highest potential daily precipitation can be up to 15 percent higher (or lower).
To better capture regional variability, Brunner developed an interactive atlas. Through a user-friendly online platform, interested parties like political decisionmakers and scientists can calculate the effects of climate variability for specific regions and extreme values on their own. According to Brunner, this is essential, especially in terms of planning adaptation measures: “Communities in Southeast Europe or tropical regions can take into account the degree of uncertainty with regard to climate extremes and integrate it into their strategies.” The atlas is freely accessible and requires no specialized background knowledge.
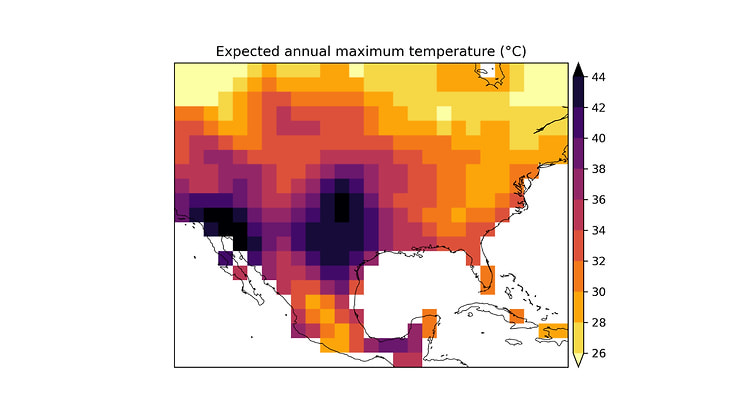
Photo: Lukas Brunner
Projected maximum annual temperature for the period 1995 – 2014 in North America. Calculated as the mean value from the maximum temperatures of all 50 simulations.
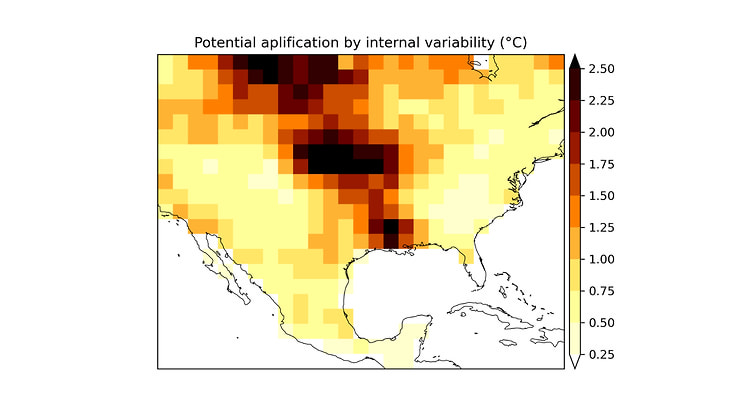
Photo: Lukas Brunner
Potential effect on the maximum annual temperature due to random climate variability. Calculated as the difference between the simulation with the highest maximum temperatures and the mean value from all 50 simulations.
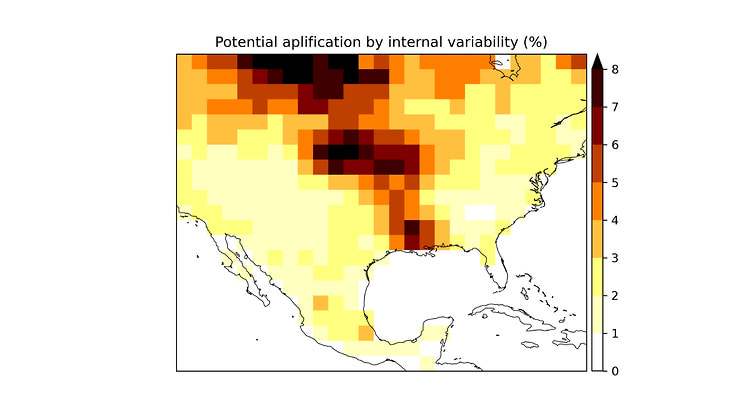
Photo: Lukas Brunner
Potential effect of random climate variability as a percentage.
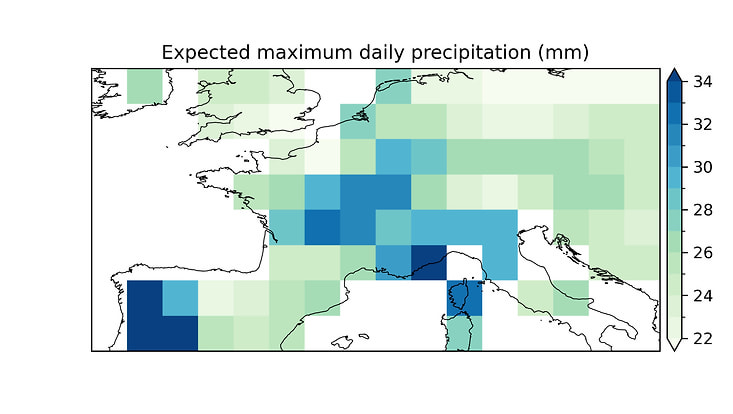
Photo: Lukas Brunner
Projected maximum daily precipitation for the period 1995 – 2014 in Europe. Calculated as the mean value from the maximum daily precipitation of all 50 simulations.
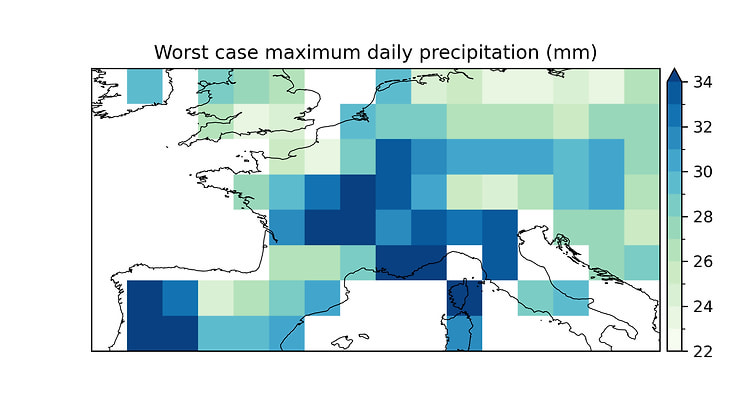
Photo: Lukas Brunner
Highest maximum daily precipitation for the period 1995 – 2014, based on 50 simulations.
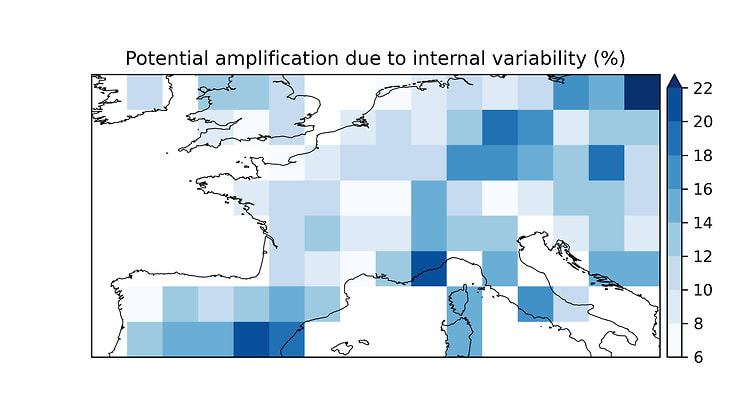
Photo: Lukas Brunner
Potential effect on the maximum annual precipitation due to random climate variability. Calculated as the relative difference between the simulation with the highest maximum precipitation and the mean value from all 50 simulations.
Brunner L., Mithal V., Borchert L. F., Sillmann J., and Poschlod B. (2026):
The Variability Atlas: How internal climate variability affects the estimation of climate extreme indices, Environmental Research Letters; DOI 10.1088/1748-9326/ae9c57
Variability Atlas for ETCCDI climate extreme indices
https://lukasbrunner.github.io/variability_atlas/
Reuters Climate Monitor: an interactive data and visualization tool (developed by Reuters) that presents climate and weather data as easy-to-use comparisons. Dr. Lukas Brunner served as a consultant in the development of the methodology behind the Climate Monitor.