Figure 4
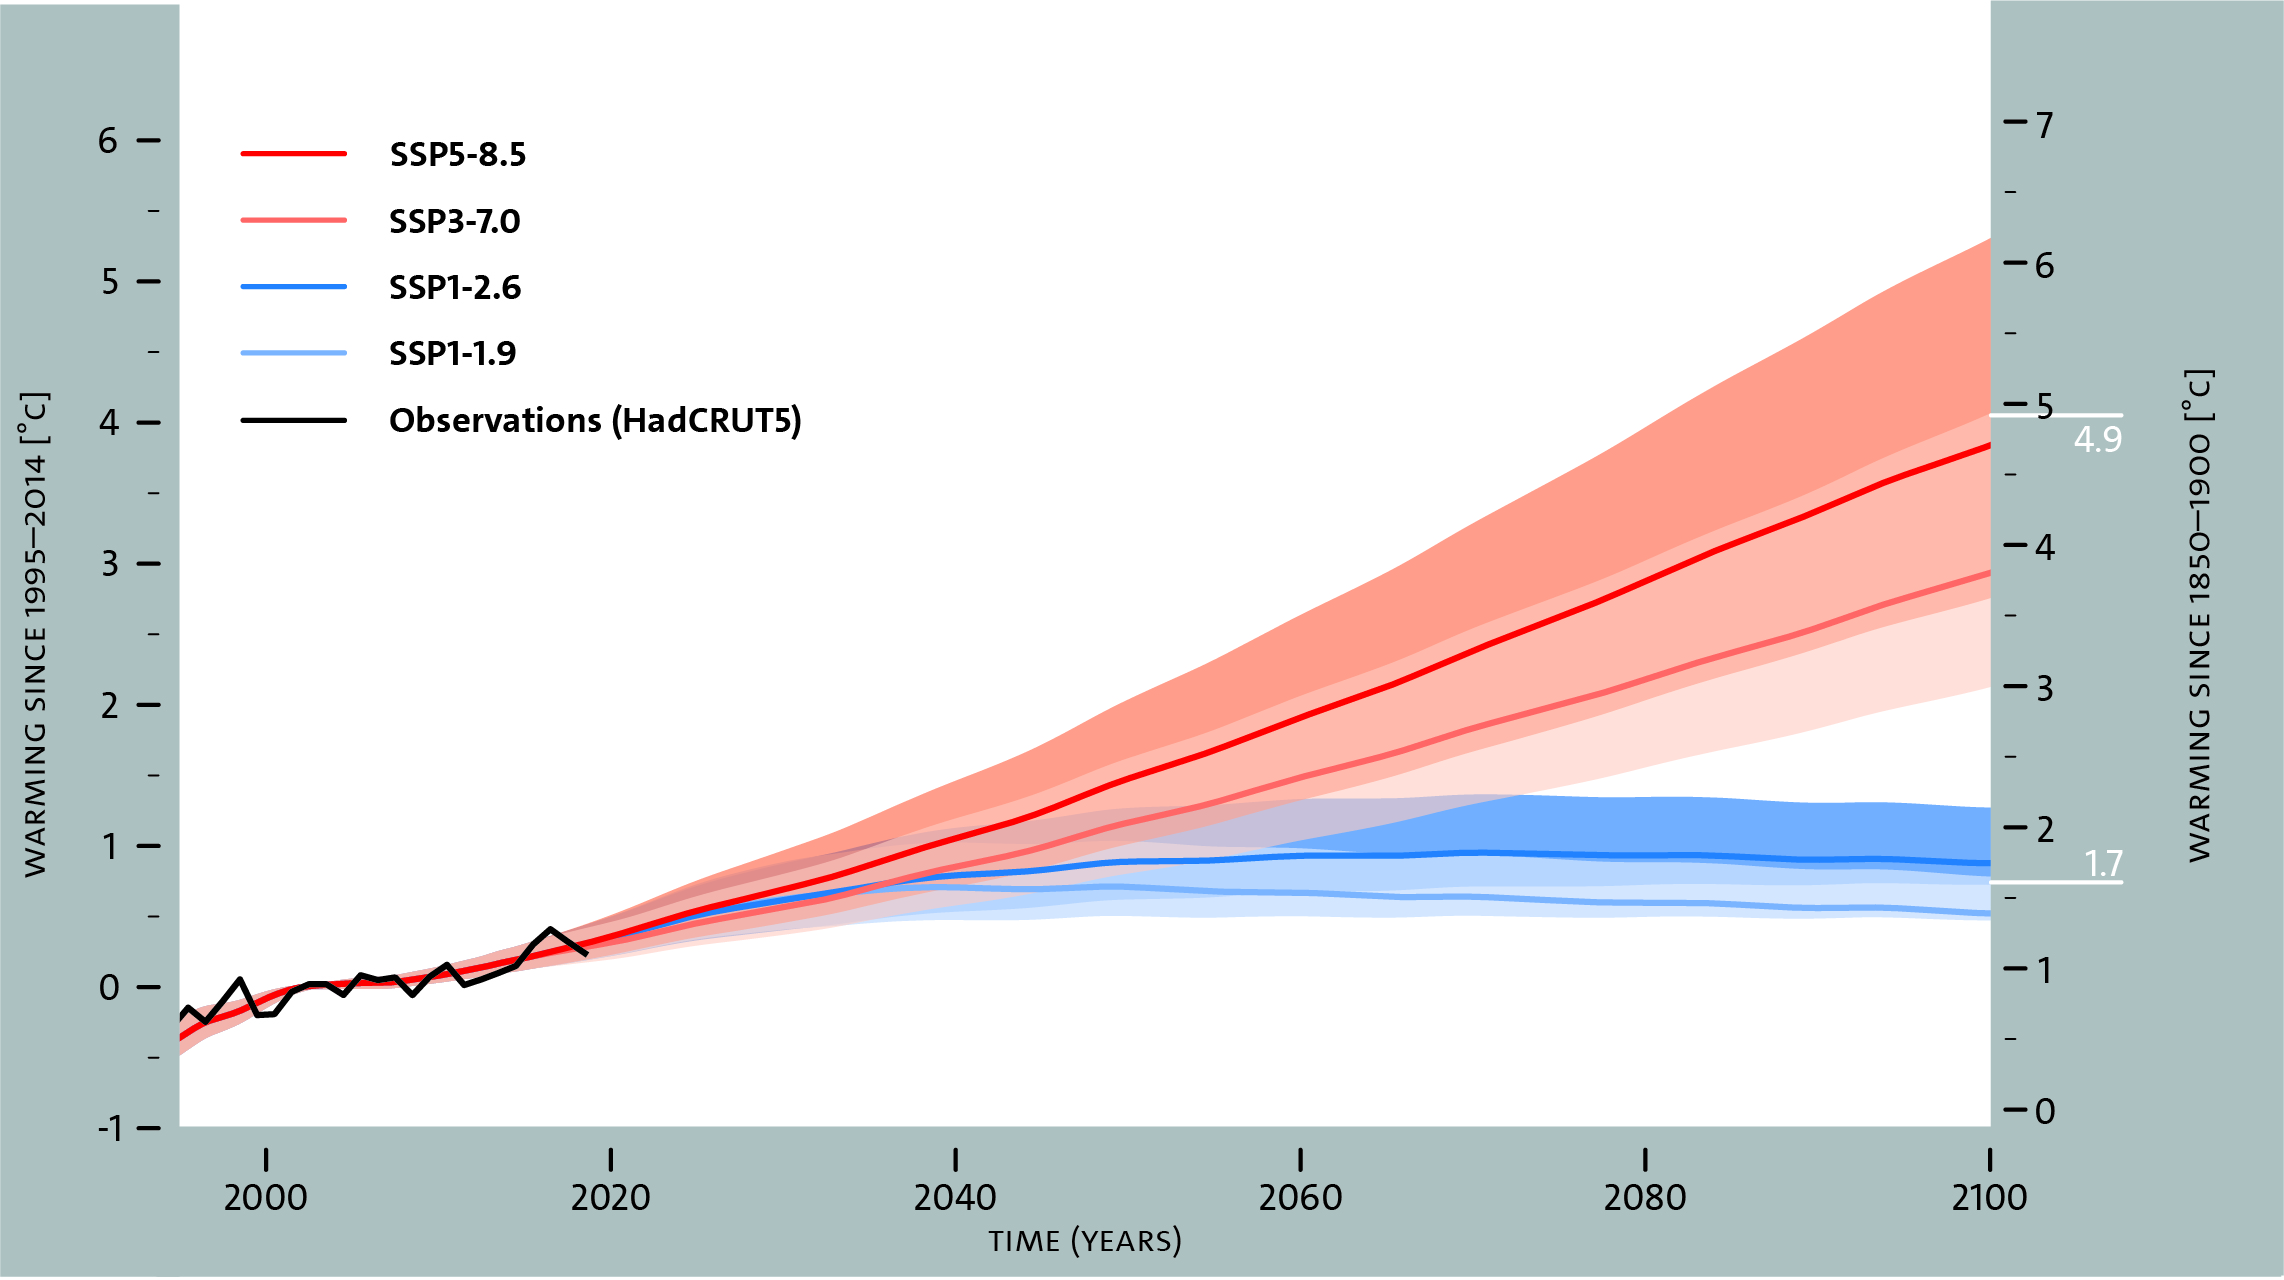
Projected 21st-century global surface warming, for the two lowest and the two highest high-priority SSP scenarios
The 90% uncertainty ranges are indicated by shading around the central estimates (lines). Observed global surface warming is shown by the black line (Morice et al., 2021). The warming is simulated relative to the recent reference period 1995–2014 (left vertical axis). To convert to warming relative to the pre-industrial period, we note that the period 1995–2014 was observed to be warmer than the period 1850–1900 by 0.87°C (Morice et al., 2021; right vertical axis).