Figure 5
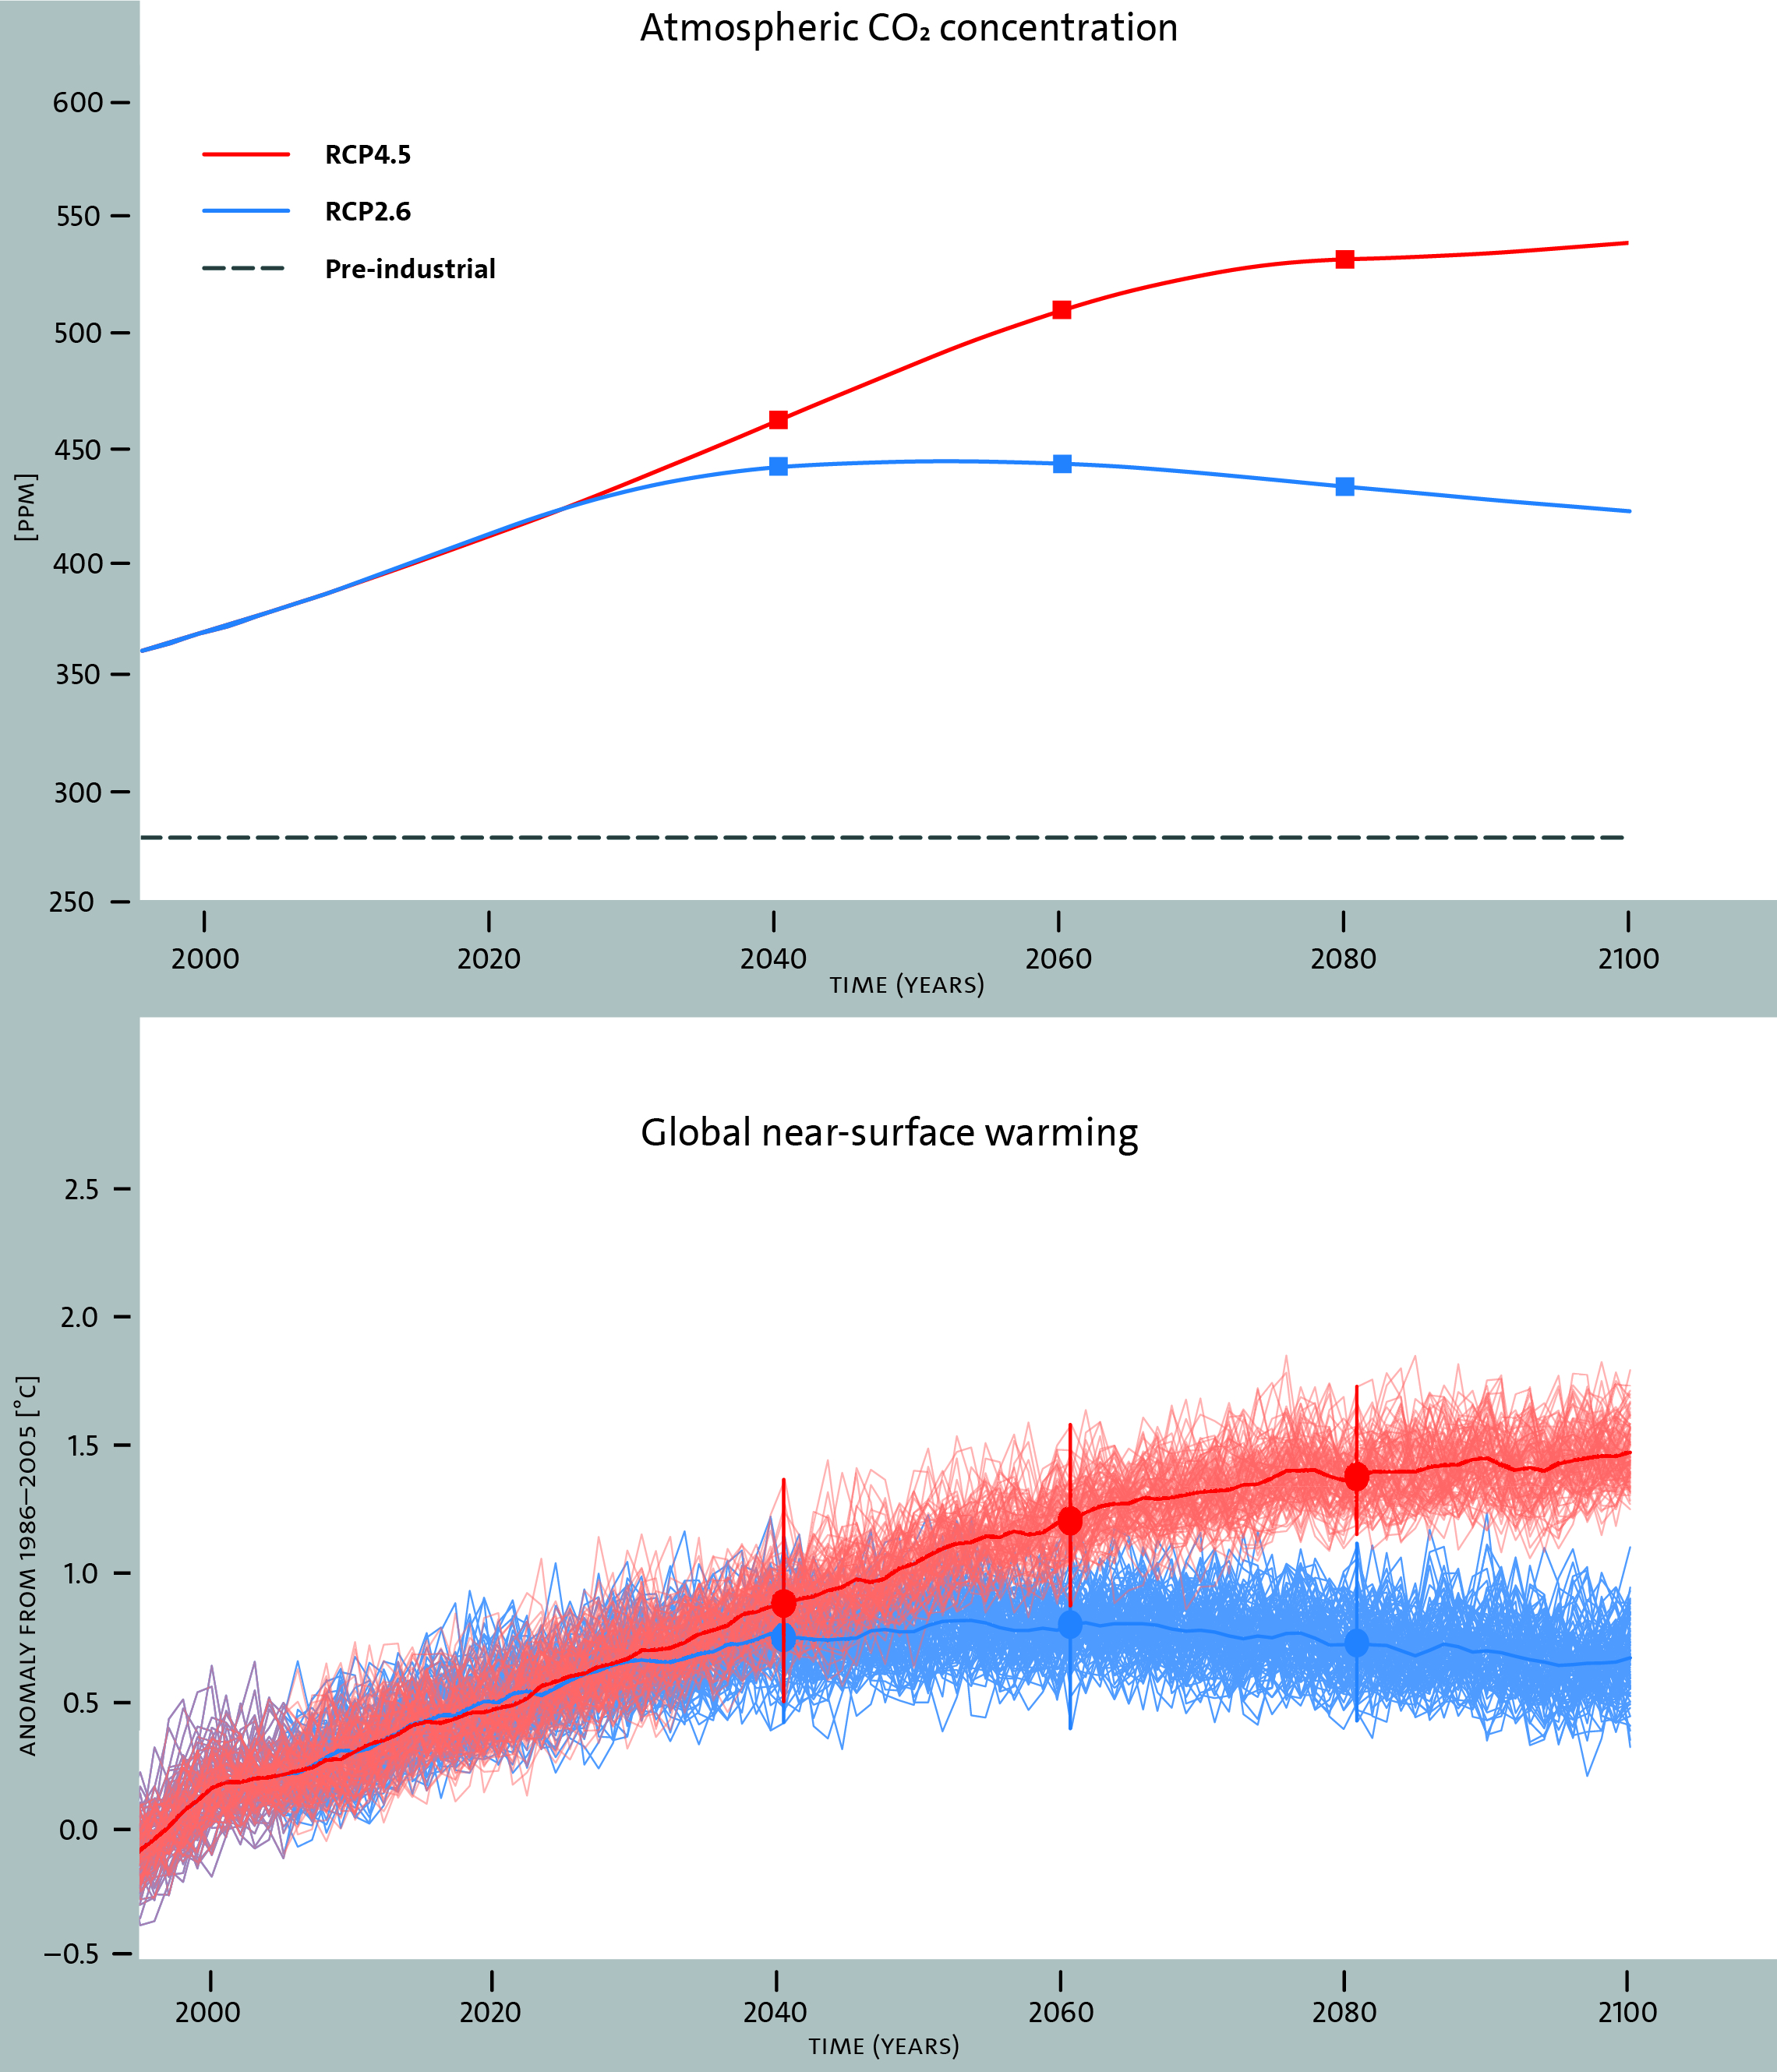
Detecting the effects of emissions reductions
Top figure shows atmospheric CO2 concentrations for two emissions scenarios, RCP2.6 and RCP4.5. Bottom figure shows an ensemble of 100 global surface warming responses to each concentration pathway (generated by the MPI-ESM Grand Ensemble; Maher et al., 2019). The ensemble mean warming is shown by the thick lines, individual simulations by thin lines. The bars describe the range of warming generated by each ensemble for the years 2040, 2060 and 2080.