Figure 6
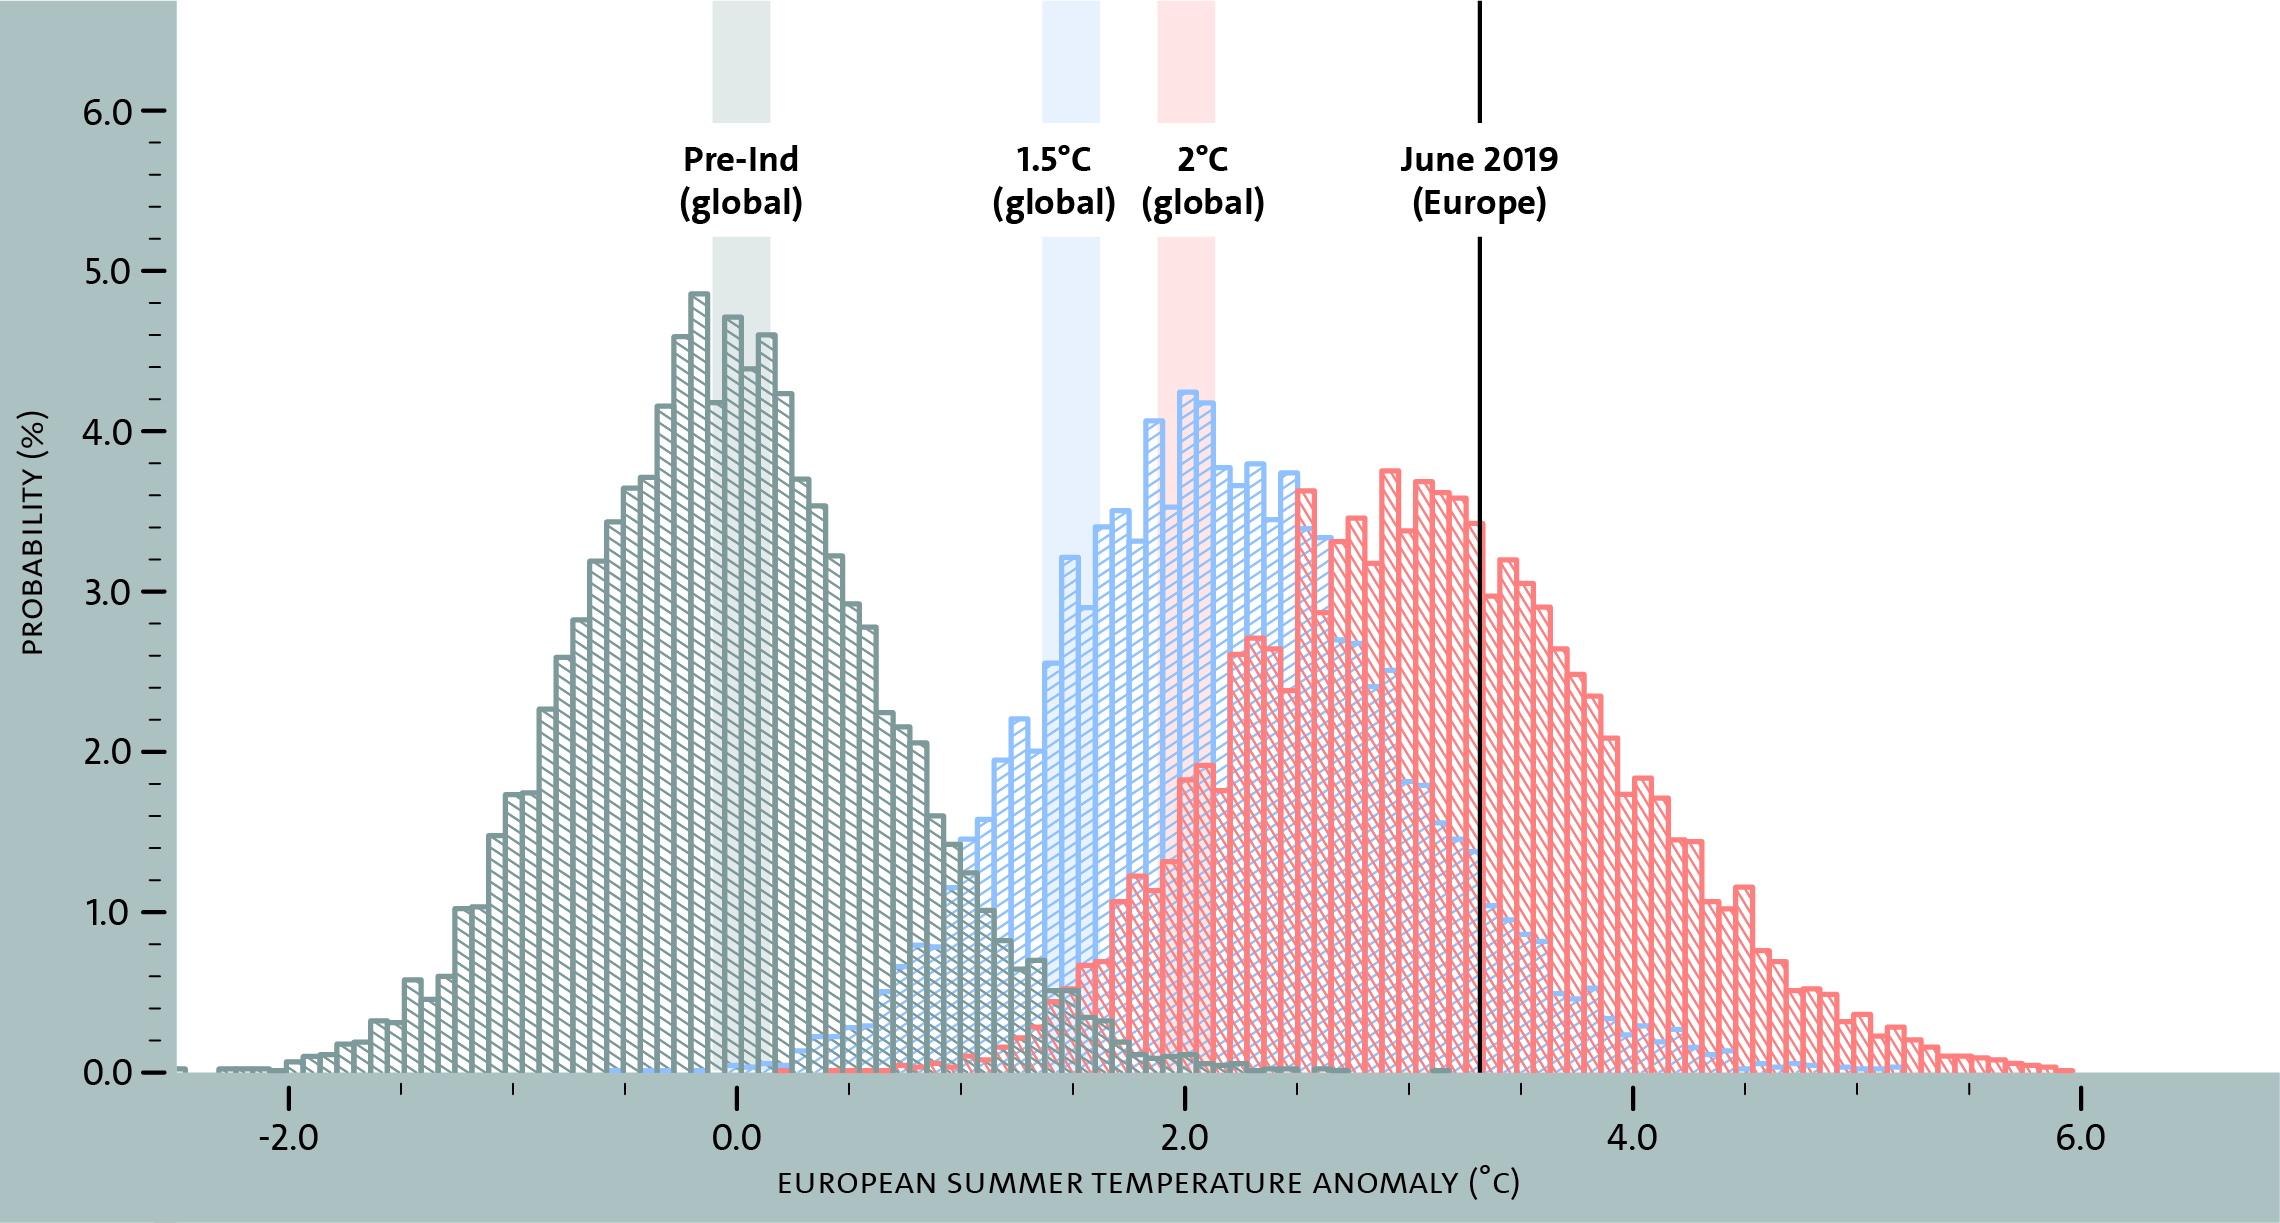
Amplified regional internal variability
Simulations with the MPI Grand Ensemble are grouped according to when the global and decadal average surface temperature shows no warming (pre-industrial, pre-ind), or when it is warmer than the pre-industrial by either 1.5°C (blue) or 2°C (red). For each such decade, the figure shows how often the European annual summer temperature increase attains a certain value. The summer values are grouped in intervals of 0.075°C. Adapted from Suarez-Gutierrez et al. (2018).