CLICCS
Cluster of ExcellenceClimate, Climatic Change,
and Society (CLICCS)
and Society (CLICCS)
Photo: UHH/Denstorf
24 March 2022, by Stephanie Janssen
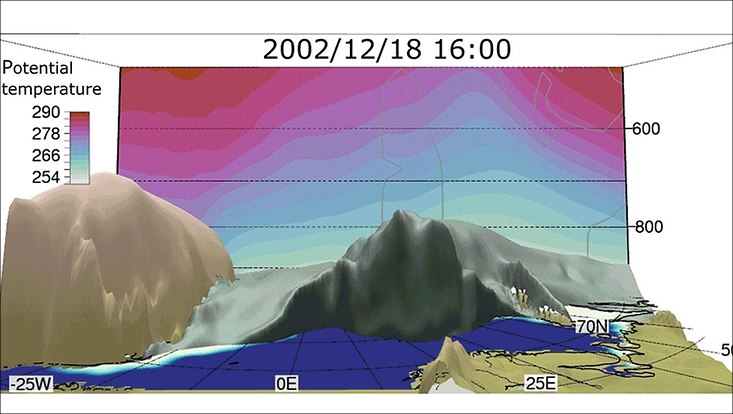
Photo: Marcel Meyer et al.
On December 18, 2002, a massive cold-air front formed in the Arctic Ocean. The icy air blew from the North Pole and across the Arctic sea ice. Over open waters it swelled into a several-hundred-meter-high wall between Greenland and Russia. When this cold dry air meets warm moist air over the ice-free ocean, turbulences develop. The cold-air front’s three-dimensional structure is visualized as a gray “mountain”; the surface of the mountain is drawn along air-masses with temperatures of minus 15 degrees Celsius (257 Kelvin).
Marine cold air outbreaks like this one can produce polar lows or cyclones accompanied by strong wind gusts, heavy snowfall and sleet. These winterstorms pose a serious risk for fishing, transport ships and offshore oil rigs. With the aid of interactive 3D visual data analysis, Dr. Marcel Meyer and Dr. Iuliia Polkova have now determined that the higher these air masses stack up, the more likely it is that a polar low will develop – an important finding for early-warning systems.
In their work, they used Met.3D, a new program now further developed at Universität Hamburg that can display meteorological data in a variety of ways. As a result, phenomena can be directly and intuitively analyzed. At the end of the video clip, the resulting polar low is shown as a brown funnel on the right-hand side of the screen.
The article was published in CLICCS Quarterly, the news from the Cluster of Excellence every three month. Find full issue -> here.

