Schematic of the MPI-GE (Grand Ensemble)
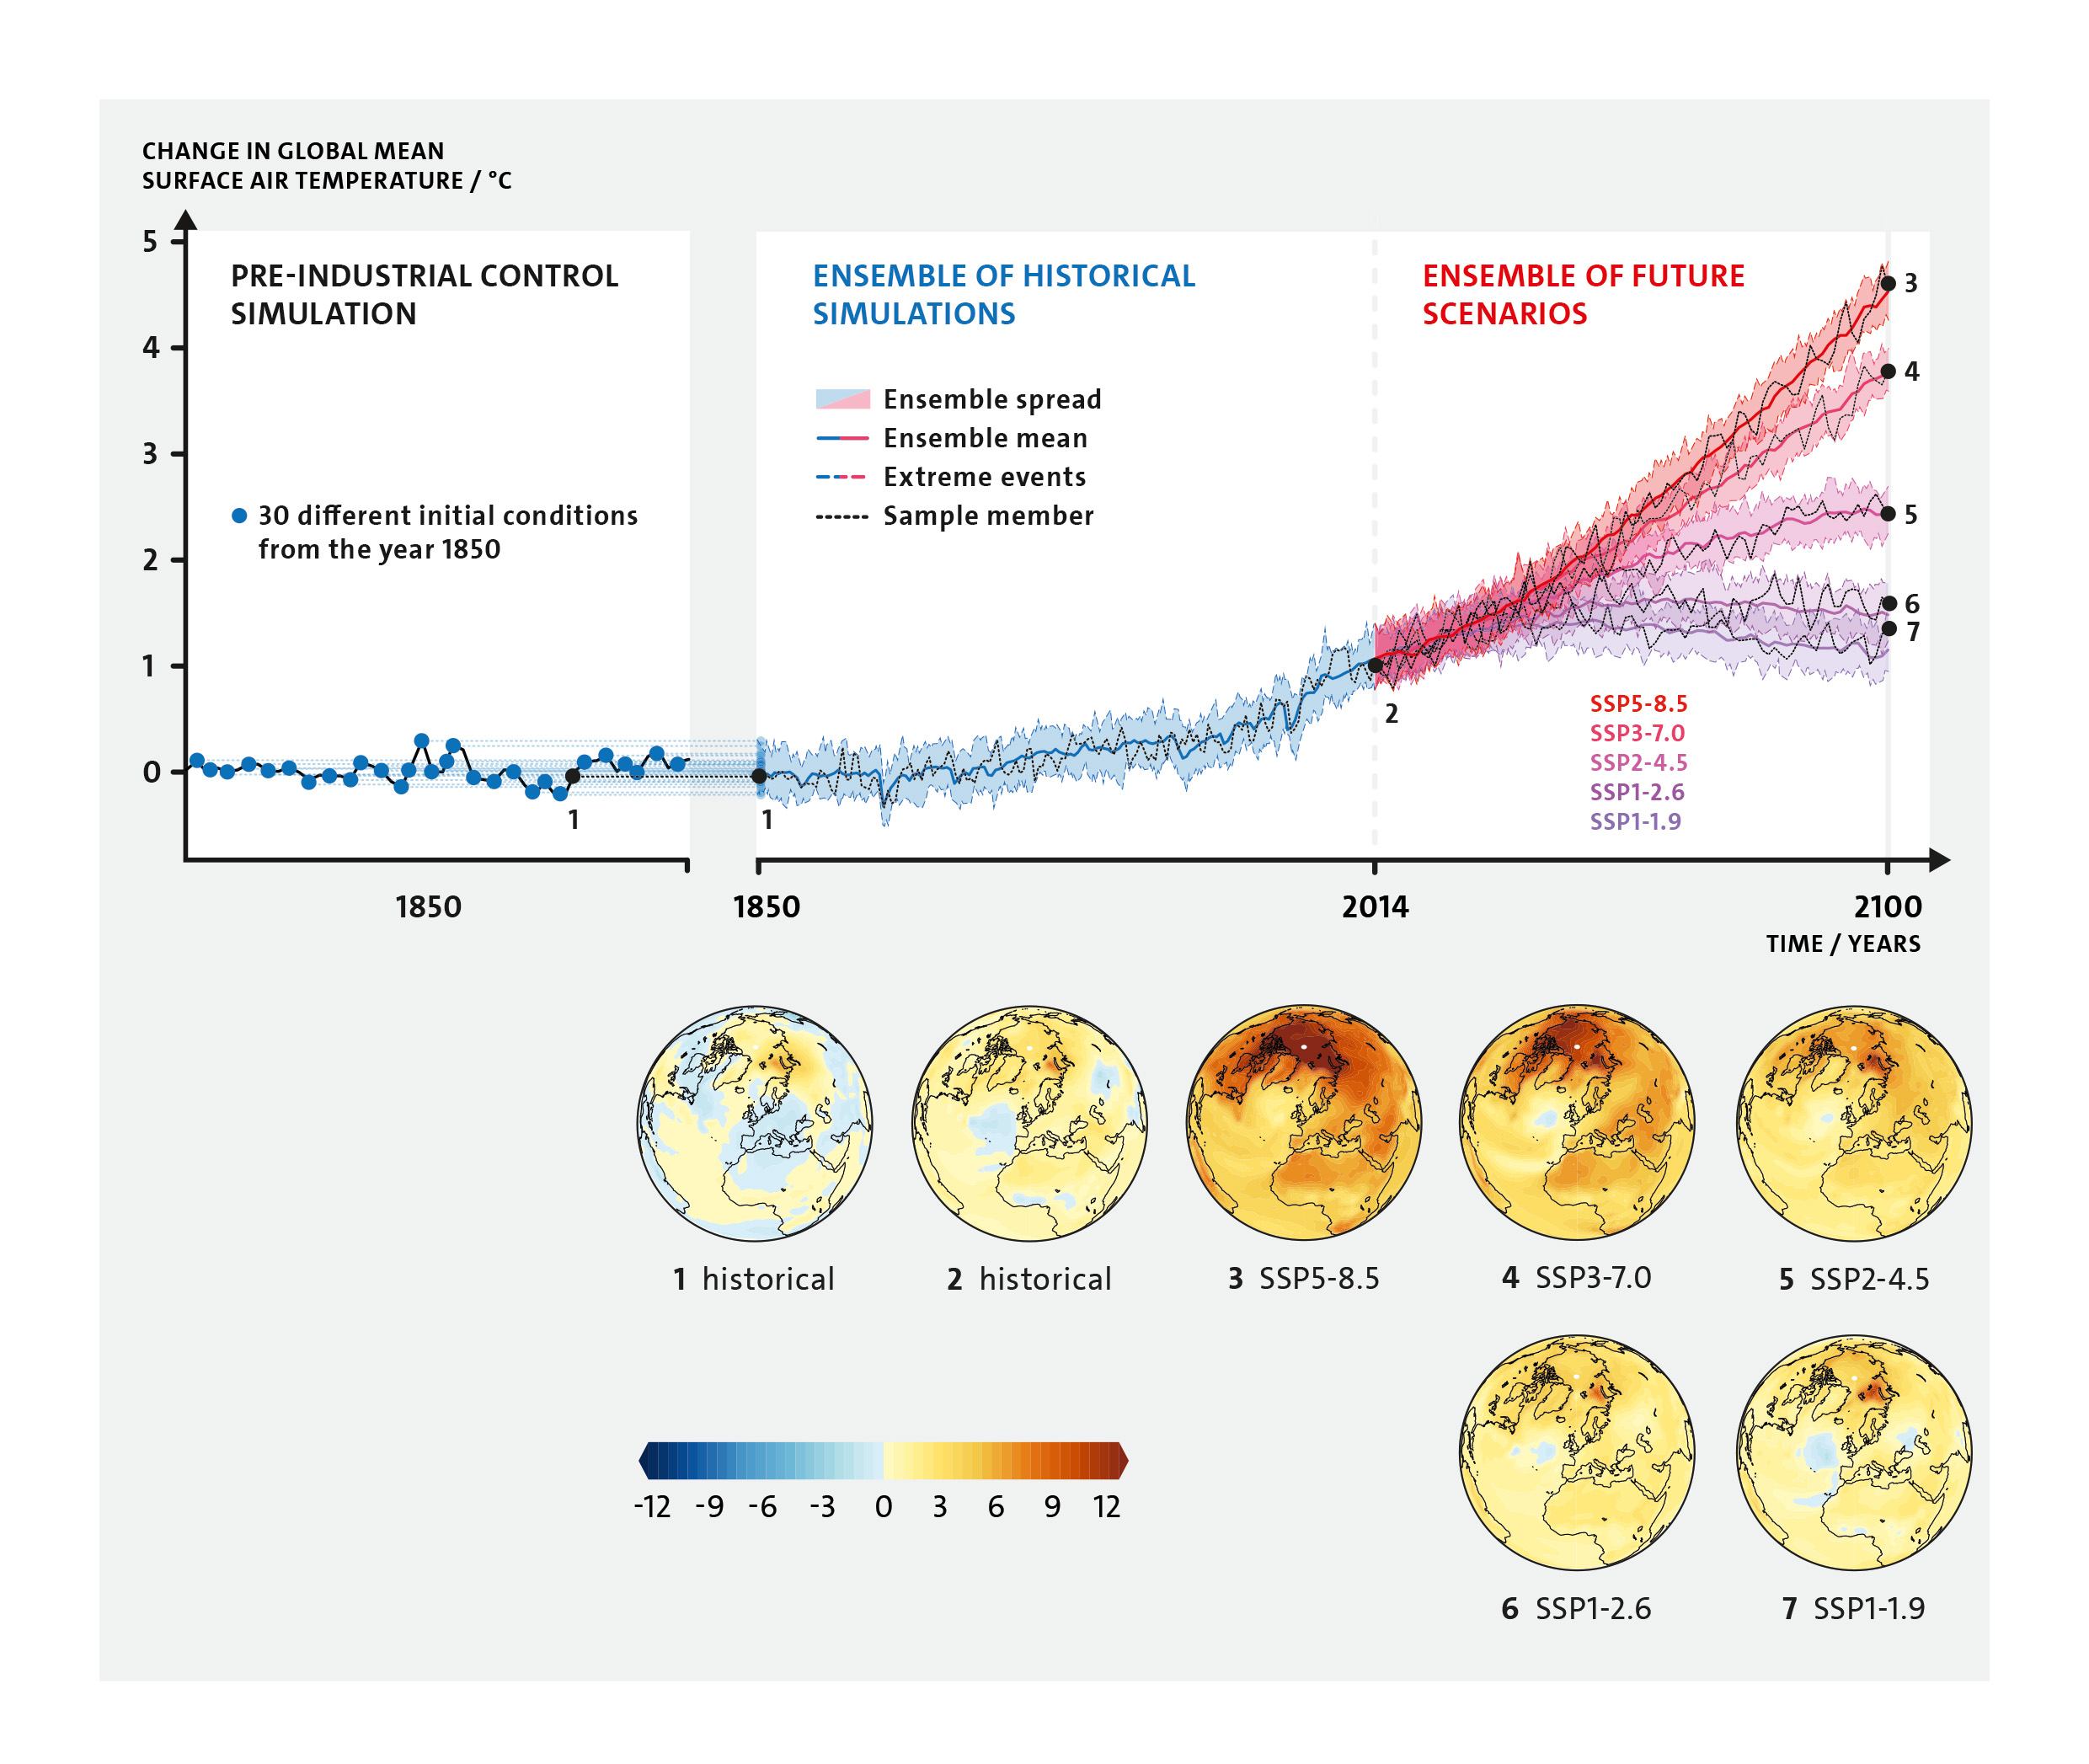
Figure 4.1: Schematic of the MPI-GE (Grand Ensemble)
Initial conditions (year 1850) for the 30 simulations are chosen from a pre-industrial control simulation and represent different conceivable climates for that year. The ensemble of 30 simulations for the historical period (1850-2014) span the possibility space of climate while considering internal variability (blue shading). The ensemble mean (blue line) estimates the forced response during that period. Five future scenarios (SSP1-1.9, SSP1-2.6, SSP2-4.5, SSP3-7.0 and SSP5-8.5) exist for all 30 ensemble members, covering the response of the climate system (red and purple lines), including uncertainty arising from internal variability (red-purple shadings). A single ensemble member is taken as an example (black line), starting from its own initial conditions in 1850 (1), which can be followed through the historical period (2) into five different futures, depending on the emission scenario (3-7). At different points in time, all ensemble members have their own climate state that represents a combination of forced response and internal variability. This is exemplified with the global temperature patterns from the first ensemble member shown at different points in time (global maps 1-7). The global maps 3-7 show the warming patterns in year 2100. Copyright