CLICCS
Cluster of ExcellenceClimate, Climatic Change,
and Society (CLICCS)
and Society (CLICCS)
Photo: UHH/Denstorf
14 December 2023, by Stephanie Janssen
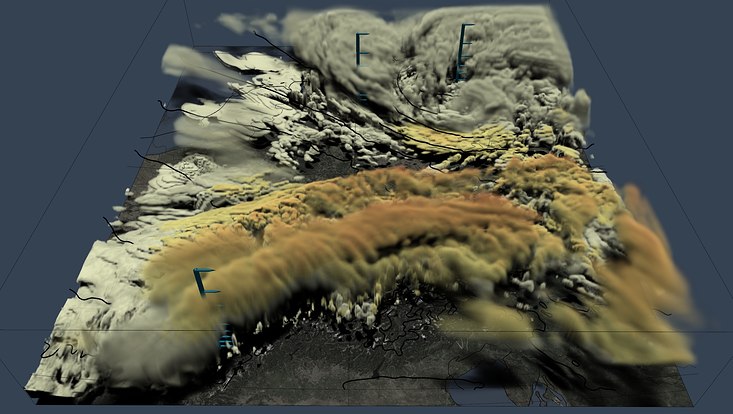
Photo: Thorwin Vogt et al.
On February 18, 2018, Winter Storm Friederike crossed Northern Germany with gale-force winds. The graphic shows the 6 pm forecast, based on data from the German Weather Service.
The clouds’ windspeeds range from yellow (ca. 30 m/s) to reddish-brown at higher elevations (ca. 60 m/s). The vertical markings (in blue) indicate the elevation. The low-lying yellow belt of clouds to the right and just above the middle is particularly interesting. Here, the storm is moving fast from west to east and can potentially cause damage at ground level – an important information for weather warnings. In the upper right corner, the clouds move around the elevation indicator, the center of the storm. But this graphic is only a snapshot.
A team led by Thorwin Vogt has developed an innovative method for visualizing clouds in 3D. “It allows us to rapidly and interactively interpret cloud data on the computer. We can see much more than in static images, and intuitively find areas of interest,” says Vogt. The visualization method was integrated into the program Met.3D, freely available online. Coauthor Dr. Marc Rautenhaus explains the visualization in detail on TV.
Study results on TV (in German, from timestamp 7:14)
The article was published in CLICCS Quarterly magazine, the research news from the Cluster of Excellence every three month.

