Visual Data Analysis
The HPC-DIS visualization project contributes to the overarching objectives of CLICCS by developing visual data analysis tools specifically tailored to the needs of CLICCS projects. Following the cross-disciplinary approach of CLICCS, we identify important needs for new visualization methods in collaboration with CLICCS researchers. We investigate application-motivated aspects of visual data analysis with the aim of developing methods that help identifying, exploring and communicating possible and plausible climate futures.
Building on our previous work in high-volume, interactive data visualization for meteorological applications, we are closely linked to projects in Theme A. Well-established collaborations between the Visual Data Analysis group at the Regional Computing Center (RRZ) at Universität Hamburg, the application-oriented visualization service group at the German Climate Computing Center (DKRZ) and the Center for Earth System Research and Sustainability (CEN) are continued and extended.

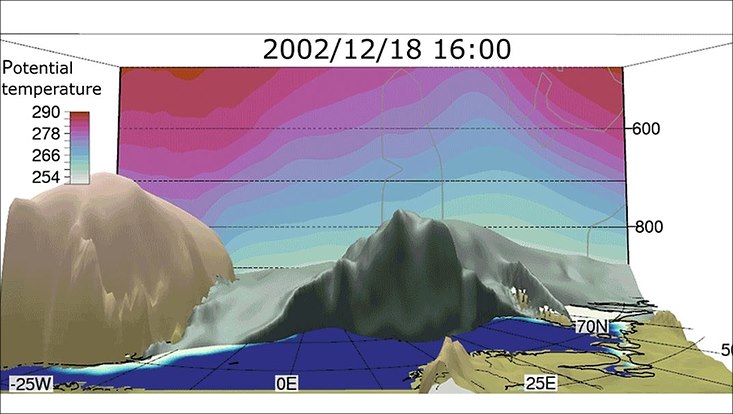
A major tool for our research is the visualization system Met.3D, developed within the RRZ Visual Data Analysis group. For example, within a recent CLICCS collaboration, we extended and used the software to investigate marine cold air outbreaks and polar lows (Meyer et al., Weather and Climate Dynamics, 2021).
Team: Thorwin Vogt, Marc Rautenhaus, Michael Böttinger, Stephan Olbrich; Alumni: Marcel Meyer
Contact: marc.rautenhaus@uni-hamburg.de

